I usually say that one cannot understand what one does not measure. Our modern daily lives revolve around energy. We power our lights & electronics, we heat our home, we commute, we travel, we buy imported goods, and we rely on social services from our states. And as a result, we emit carbon, a lot.
The human body, runs on an average of 100W of power at rest. That said, each one of us uses much more power than what our whole bodies consume. For instance, the MacBook Pro and external display from which I am writing this article, consume north of 150W, which is 50% more than my body sitting at my desk.
Primer
When we reflect about the energy we consume, it’s important to think about the equivalent Joules, regardless on how it gets generated (coal, wind, nuclear, organic, etc.). 1 Joule, as per Wikipedia, is:
Equal to the energy transferred to an object when a force of one newton acts on that object in the direction of the force's motion through a distance of one meter.
1 Joule equals 1 Watt-second. We should first strive to reduce to number of Joules powering our daily lives in order to reduce the amount of carbon that we put in the air.
Obviously, each Joule of energy that we consume was not generated in the same way. Depending on the source of energy, the carbon intensity of each Joule varies dramatically. For instance — using the Watt-hour unit, where 1 kWh = 3.6 Megajoules — 1 kWh of electricity generated through coal emits about 1kg of CO2; natural gas 410g, while nuclear would only be about 10-20g (fission reactors only “emit” water vapor, though the end-to-end production life-cycle still emits small amounts of CO2).
All that said, we do not yet fathom how much tons of CO2 a year we emit through seemingly harmless consumption habits. Here are some recent CO2eq (CO2-equivalent) estimates of average per-capita yearly carbon footprint (also accounting for all per-capita emissions off-country eg. you buy goods manufactured in China):
- 🇺🇸 United States: 17.10 tons of CO2eq / capita
- 🇨🇳 China: 10.10 tons of CO2eq / capita
- 🇫🇷 France: 11.0 tons of CO2eq / capita (note that local emissions are only 4.60 CO2eq / capita, as most goods consumed are produced off country)
Note that as the middle class rises in developing countries, a lot more countries will ramp up to this ~10.00 tCO2eq per capita number, which seems to represent the environmental cost of enjoying a modern way of life based off of fossil fuels. For instance, the tCO2eq per capita in Peru was only 1.87 tons per person in 2016 (not sure if this accounts for off-country emissions of imported goods, though).
Popular Misconceptions
Some of us would feel like saving the planet by not buying this new shiny iPhone. Numbers prove that this is, relatively, a pointless effort. Indeed, a lot of people are still living in poorly isolated homes heated with natural gas. To provide some numbers, as per Apple’s environmental report, the iPhone 13 has a lifecycle CO2eq of (only) 64kg, while heating a 100 sqm home with natural gas emits in the range of 1 to 4 tons of CO2eq (a year!), depending on various factors such as insulation, efficiency and type of gas used.
Given all those popular misconceptions about “what’s green” and “what’s not green”, the best thing to do is to estimate one’s carbon footprint for the year! You’d be surprised how poorly certain things we take for granted perform in terms of tCO2eq (such as heating).
Estimating One’s Footprint
Quite a few carbon footprint estimation tools are available online. But after trying out 3 of them, inputing the same data, they all gave me results that were off of each other by 30%. There is a huge uncertainty factor on the numbers I got, which lead me not to trust them.
This brought me to the realization that I had to come up with my own model to estimate my carbon footprint, all in a spreadsheet. This forced me to research each area that should be considered in the model, and well as seek to justify where each number comes from. The results I got are super interesting. My model seems to be reliable, as my footprint is in par with the average per-capita footprint for France!
The Estimation Model
The estimation model I came up with can be downloaded and filled with your data, using the Numbers app on macOS. It contains my carbon footprint data for 2021 as an example.
The model is divided into the following categories, that all add up to a grand total:
- Trips (plane, car, bus and train);
- Manufactured goods (eg. the new computer you bought);
- Leisure (eg. hotels);
- Living (eg. food + trash);
- Energy (eg. electricity + heating);
- Indirect (eg. state services);
While obtaining a total tCO2eq for certain categories is fairly easy and reliable (such as everything that falls into trips, given that it’s a number of km multiplied by the grams of CO2eq / km, which is always provided by car manufacturers or online estimations), other categories such as leisure (think: hotels) are a bit more tricky to get right. In the latter case, rough estimations are made, based on online searches, adjusted with a pessimistic corrective tCO2eq number. If we cannot reliably estimate a number, let’s at least be pessimists to get things right. Your estimations are as good as your sources are.
For example, the category for car trips gives the following:
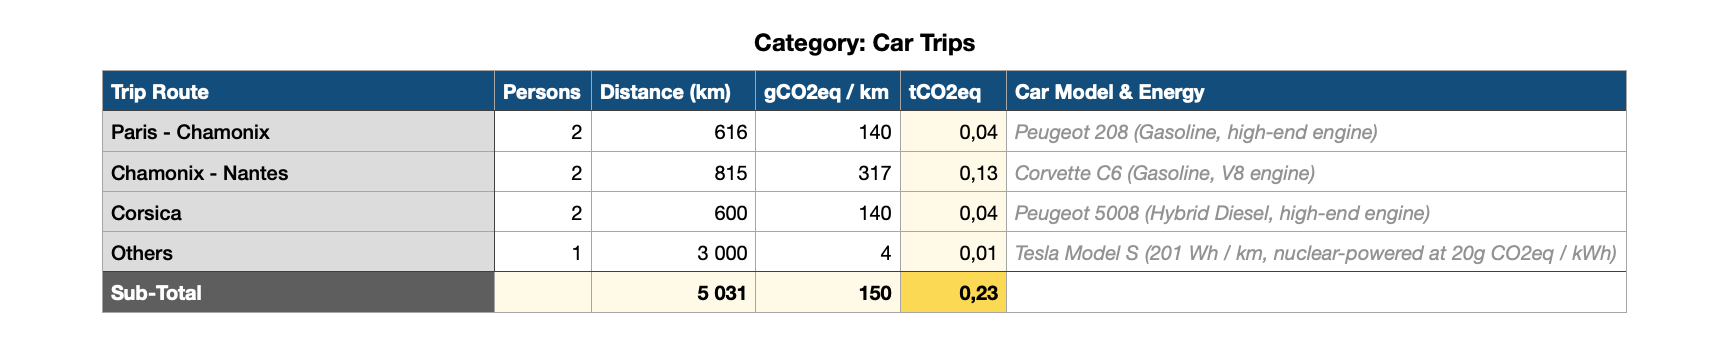
Input your trip routes, the number of km, the typical gCO2/km for the car used, as given by the manufacturer, and let the spreadsheet do the rest!
My Own Results For 2021
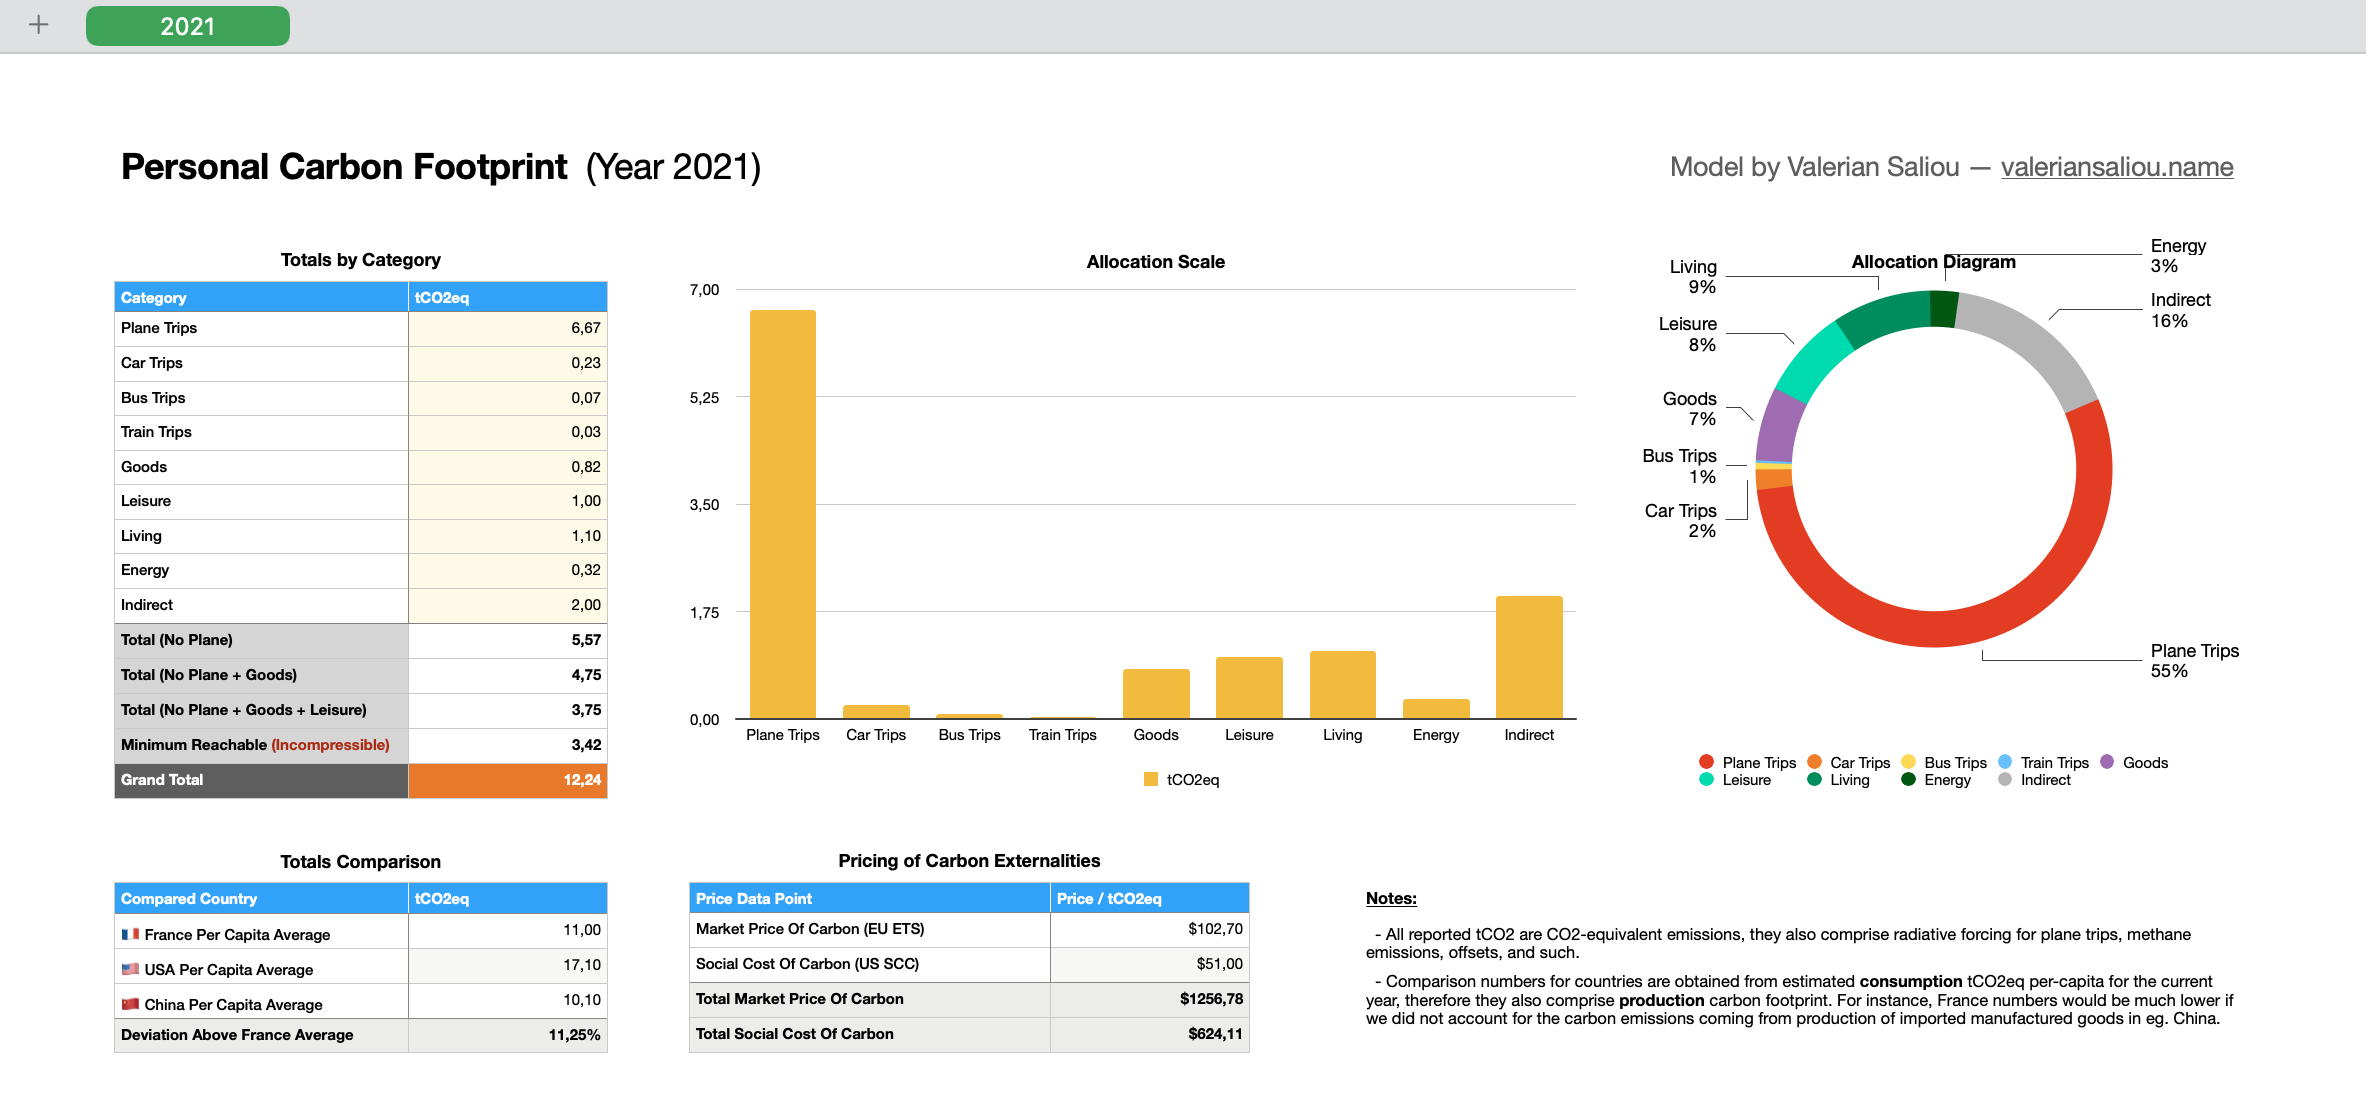
Those are the totals I came up with for my 2021 carbon footprint:
You can also view my full carbon footprint estimation report for 2021, containing all details and calculation methods. This document was exported from my model spreadsheet.
My grand total for 2021, including off-country emissions due to eg. buying electronics manufactured in China, is: 12.24 tons of CO2eq. Which is about 11% above France per-capita average (11.00 tCO2eq), but way below the US per-capita average (17.10 tCO2eq, for reference). This is by no means a good number, which can be easily improved.
Here’s an overview of my situation regarding habits and energy use (which are probably not typical, but it significantly affects the results I got):
- Living in Nantes, France; where typical winters temperatures are cold: fluctuating from -5C to 10C. Summers are typically 25C;
- My apartment is brand new, 70 sqm, built with the latest thermal insulation norms;
- Heating through natural gas, though I opted for biogas which is about 2x less carbon intense per kWh (through my energy provider). I heat to 18C during the day in winter, 16C during the night;
- Electricity in France is typically nuclear, though I opted for hydro power (through my energy provider). My electricity usage is quite low as most of my appliances are energy efficient;
- My car is an EV (Tesla Model S 2014), charged in its parking via nuclear;
- I eat a vegetarian diet, which is less carbon intensive than eating meat. Note that vegan diets are the most efficient ones regarding carbon, but, hey;
- I do not produce a lot of trash that does not get recycled. It is important to note that the process of incinerating trash produces a lot of CO2, about a bit more than the total weight of trash that gets burned (in the 0.7x-1.7x range, meaning burning 1 ton of trash results in 0.7 tCO2, up to 1.7 tCO2);
- I travel by plane. Super often. Much more than per-capita average. I’ve worked remotely for half of 2021, which led me to take a lot of pan-European and long-distance flights;
- Lastly, I need to account for the incompressible per-capita carbon footprint linked to services catered by the state (health, education, infrastructure, defense, etc.). As a French citizen, this is estimated to be 1.5 tCO2eq per capita per year.
Outro
That’s all! I hope that sharing my carbon footprint model can save you some time in doing your own. Leading you to ultimately act on reducing your emissions.
To give an example of how I leveraged this model to produce actual results: we used the model to estimate Crisp offices carbon footprint, to discover that our 160 sqm office space heated with natural gas, emitted a total of 8.0 tCO2eq over the year of 2021 (!!!). That’s about 19MWh of energy consumed for heating. We took corrective action to switch to a biogas provider (2x less carbon intensive), modernize the heating system and add a Netatmo thermostat and smart valves on the radiators (2x kWh reduction). We are now aiming for 2.0 tCO2eq in 2022, a 4x total reduction in emissions.
Measuring is the first step of any optimization process. After all, it’s not so much different than optimizing software as a software developer. And it can be a lot of fun, too!
🇫🇷 Written from Nantes, France.